AI Agents
How to Monitor AI Agents in Production: Traces, Costs, Alerts
How to monitor AI agents in production: what to trace per step, 8 alert rules, cost per session math with November 2026 prices, and what monitoring tools cost.

In this article
- What does monitoring AI agents in production actually involve?
- What should you log for every agent run?
- Is OpenTelemetry ready for AI agent tracing?
- Which metrics matter most for AI agents?
- What should trigger an alert, and who gets it?
- How do you monitor the cost of each agent session?
- How do you monitor answer quality without reading every transcript?
- Native cloud tools or an LLM observability platform?
- What does AI agent monitoring cost?
- What should you not log? Privacy and retention
- A 30-day plan to get an agent properly monitored
- The bottom line on monitoring AI agents in production
- Frequently asked questions
- Sources
Here is how to monitor AI agents in production, in one paragraph: trace every run step by step (each model call, tool call and retry, with tokens, cost, duration and status), score whether the run actually finished the task, and alert on patterns: falling completion rates, rising tool errors, loops, sessions that cost several times the median, and spend above budget. Ordinary uptime monitoring is not enough, because an agent can return a clean HTTP 200 while it loops, calls the wrong tool or makes up an answer.
This guide is for the founder, CTO or operations leader who has an agent live (or about to be) and needs to know what is happening inside it. You will get the fields to log for every run, the current state of the OpenTelemetry standard for agents, an alert scorecard with starting thresholds, a worked cost-per-session example using November 2026 model prices, a price comparison of the main monitoring tools, the privacy rules for storing prompts, and a 30-day rollout plan.
What does monitoring AI agents in production actually involve?
Monitoring an AI agent in production means answering four questions for every run: did it finish the job, what did it do along the way, what did it cost, and did it do anything it should not have. Application performance monitoring answers only part of the second question.
The gap matters because agents fail quietly. A conventional web request either works or throws an error. An agent run can make twelve model calls, retry a failing API five times, pull the wrong customer record and still produce a confident, well-formatted reply. Nothing in your error logs changes. The customer notices first, or finance does when the invoice arrives.
Cost and risk control are where agent projects die. Gartner predicted in June 2025 that over 40% of agentic AI projects will be canceled by the end of 2027, citing escalating costs, unclear business value or inadequate risk controls. Monitoring is how you see all three early: the cost per run, the share of runs that deliver the outcome, and the actions that needed a human.
Monitoring is also expected by the main US risk framework. The NIST AI Risk Management Framework's MANAGE 4.1 subcategory calls for post-deployment monitoring plans that include capturing input from users, appeal and override, incident response, recovery and change management. If you sell into banks, insurers or healthcare, a customer's vendor review will ask how you do this.
Key takeaway: Agent monitoring has four layers: outcome (did it finish the task), behavior (which steps and tools), cost (tokens and dollars per run) and risk (blocked or sensitive actions). Most teams start with only the infrastructure layer underneath them.
What should you log for every agent run?
Log one trace per run, with a span for the run itself, a span for every model call and a span for every tool call, and attach the numbers you will alert on to each span. If you only capture final answers, you cannot tell a model problem from a tool problem from a data problem.
The table below is a practical minimum. The OpenTelemetry names in the third column come from the GenAI agent span conventions, the inference span conventions and the execute tool span conventions; fields without a standard name are ones you add yourself.
| Level | Field | Standard name (where one exists) | Why you need it |
|---|---|---|---|
| Run | Session or run ID, user or tenant ID | gen_ai.conversation.id for the conversation; your own for tenant |
Group steps into one run and cost by customer |
| Run | Agent name and version, prompt version | gen_ai.agent.name, gen_ai.agent.version |
Compare behavior before and after a release |
| Run | Outcome: completed, escalated, failed, abandoned | Custom attribute | The single most important quality signal |
| Run | Step count, retry count, total cost | Custom attributes | Loop and runaway-cost detection |
| Model call | Model requested and model used | gen_ai.request.model, gen_ai.response.model |
Catch silent model changes and fallbacks |
| Model call | Input, output and cached tokens | gen_ai.usage.input_tokens, gen_ai.usage.output_tokens, gen_ai.usage.cache_read.input_tokens |
Cost per step and context growth |
| Model call | Finish reason | gen_ai.response.finish_reasons |
Truncation (length) and content filter hits |
| Tool call | Tool name, call ID, type | gen_ai.tool.name, gen_ai.tool.call.id, gen_ai.tool.type |
Which integration is failing |
| Tool call | Status, error type, duration | Span status, error.type |
Tool error rate and slow dependencies |
| Tool call | Arguments and results | gen_ai.tool.call.arguments, gen_ai.tool.call.result (opt-in) |
Debugging, but may contain personal data |
| Run | User feedback, evaluator scores | Custom events or your platform's score API | Ground truth for quality trends |
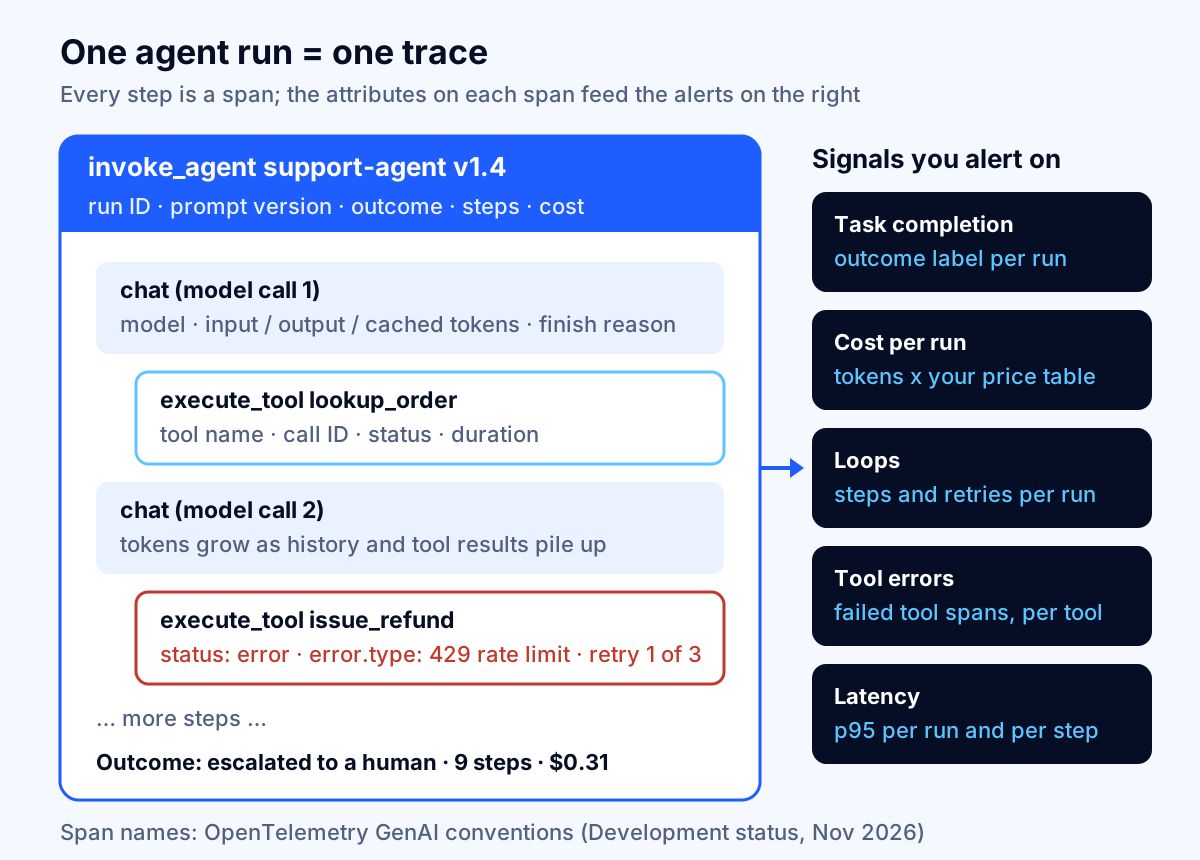
Two fields are routinely missing and later regretted. The first is the outcome label: without it, you can measure speed and cost but never success. Set it in code where you can (the ticket was closed, the order was updated, the agent handed off to a human) and from user feedback or an evaluator where you cannot. The second is the prompt and configuration version, so that a jump in failures can be tied to the Tuesday release instead of guessed at.
Is OpenTelemetry ready for AI agent tracing?
Yes for practical use, no for long-term stability. As of November 2026, every span, metric and attribute in the OpenTelemetry GenAI conventions is still marked Development, the first maturity level, and the conventions have moved out of the main specification into their own semantic-conventions-genai repository. The old pages on opentelemetry.io now point there.
The conventions already define what most teams need. There are spans for create_agent, invoke_agent (when the model drives control flow through tool calls), invoke_workflow (when your code defines the flow, as in a LangGraph graph), a plan span and execute_tool. The metrics file defines duration histograms such as gen_ai.client.operation.duration and server-side gen_ai.server.time_to_first_token. Notably, there is no standard cost attribute: you compute cost yourself from token counts and your price list.
Platform support is broad. Microsoft Foundry's tracing guide instruments Foundry agents, Microsoft Agent Framework, Semantic Kernel, LangChain, LangGraph and the OpenAI Agents SDK with OpenTelemetry and sends traces to Application Insights. Amazon Bedrock AgentCore generates session metrics automatically for agents on its runtime and shows spans in CloudWatch's generative AI observability page, after a one-time setup that turns on CloudWatch Transaction Search; detailed spans require instrumenting your agent code.
What to do about the Development status:
- Use the conventions anyway. They are the closest thing to a common language, and every major tool maps to them.
- Pin instrumentation library versions and read release notes before upgrading, because attribute names can change.
- Keep your own attributes in your own namespace (for example
app.outcome,app.cost_usd) so a convention change never breaks your dashboards. - Export through an OpenTelemetry Collector rather than a vendor SDK where you can, so changing tools later is a configuration change, not a rewrite.
Which metrics matter most for AI agents?
Track eight signals: task completion rate, escalation rate, tool error rate, steps per run, cost per run, daily spend, latency and blocked actions. Each one maps to a failure you will otherwise hear about from customers or finance.
The scorecard below gives a measurement and a starting alert rule for each. The thresholds are Fleurant AI planning defaults, not industry benchmarks: run for two to four weeks, measure your own baseline, then tighten them.
| Signal | How to measure | Starting alert rule | Typical cause when it fires |
|---|---|---|---|
| Task completion rate | Runs with outcome = completed ÷ all runs, per workflow | Drops 5 points below the 7-day average over 1 hour | Prompt or model change, upstream data change |
| Escalation rate | Runs handed to a human ÷ all runs | Rises 50% above the 7-day average | New request types, tool outage, stricter guardrail |
| Tool error rate | Failed tool spans ÷ tool spans, per tool | Above 5% over 15 minutes, or 3x baseline | API schema change, expired credentials, rate limits |
| Steps per run | Model plus tool calls per run | Any run over a hard limit (for example 25 steps) | Loop, ambiguous tool result, missing stop condition |
| Cost per run | Sum of token and paid tool costs per run | Any run over 5x the median; p95 up 30% week over week | Context growth, loop, model fallback to a pricier tier |
| Daily spend | Provider usage or cost API, by workspace or key | Forecast to exceed the monthly budget | Traffic growth, runaway job, leaked key |
| Latency | p50 and p95 seconds per run and per step | p95 up 50% after a release | Slow tool, larger context, provider congestion |
| Blocked or high-risk actions | Count of guardrail blocks and approval requests | Any attempt at a forbidden action; spike in blocks | Prompt injection attempt, permission drift |
Two habits make this scorecard work. First, segment by workflow: an agent that both answers billing questions and updates orders has two completion rates, and averaging them hides the broken one. Second, alert on patterns over a window, not single events. One failed run is noise; a 5-point drop across an hour of traffic is an incident.
What should trigger an alert, and who gets it?
Alert on anything that means customers are getting wrong results, money is leaking or the agent tried something it must not do; send everything else to a dashboard. An alert without a named owner and a runbook gets muted within a month.
Route alerts by type:
- Page someone now: completion rate collapse, any attempted forbidden action (for example a refund above the agent's limit or a write to a system it should only read), a runaway session still running, or a spend forecast that will breach a hard budget today.
- Ticket for the next business day: gradual completion or escalation drift, one tool's error rate above baseline, p95 latency regression after a release, rising cost per run.
- Weekly review only: user feedback trends, evaluator score trends, new clusters of failed conversations.
Back the alerts with hard limits in code, because an alert only tells you after the fact. Set a maximum number of steps per run, a maximum token or dollar budget per run, a timeout per tool call and per run, and per-user rate limits. The OWASP LLM10:2025 Unbounded Consumption entry recommends exactly this mix: rate limiting and user quotas, continuous monitoring of resource use, logging with anomaly detection, and timeouts and throttling for resource-intensive operations.
For agents that can change data or spend money, the strongest monitor is a design decision: route high-impact actions through an approval step and log the approval as part of the trace. Our guide to MCP server security best practices covers least-privilege tool permissions, which shrink what an alert has to catch.
How do you monitor the cost of each agent session?
Compute cost on every model span from its token counts and your price table, roll it up to the run, and watch the distribution, not just the total. A small share of runaway runs can move the monthly bill far more than the average run does.
Here is a worked example with list prices from Anthropic's pricing page, checked November 5, 2026. Claude Sonnet 5.5 costs $2 per million input tokens, $10 per million output tokens, $2.50 per million for 5-minute cache writes and $0.10 per million for cache hits. Assume a support agent that makes six model calls per run, averaging 12,000 input tokens (system prompt, tools, history and retrieved documents) and 500 output tokens per call.
| Scenario | Input cost | Output cost | Cost per run |
|---|---|---|---|
| Normal run, no caching: 72,000 input and 3,000 output tokens | $0.144 | $0.030 | $0.174 |
| Same run with 80% of input served from cache (57,600 hit tokens, 14,400 written at the cache-write price) | $0.036 + $0.006 | $0.030 | $0.072 |
| Runaway loop: 40 calls averaging 30,000 input and 500 output tokens | $2.400 | $0.200 | $2.600 |
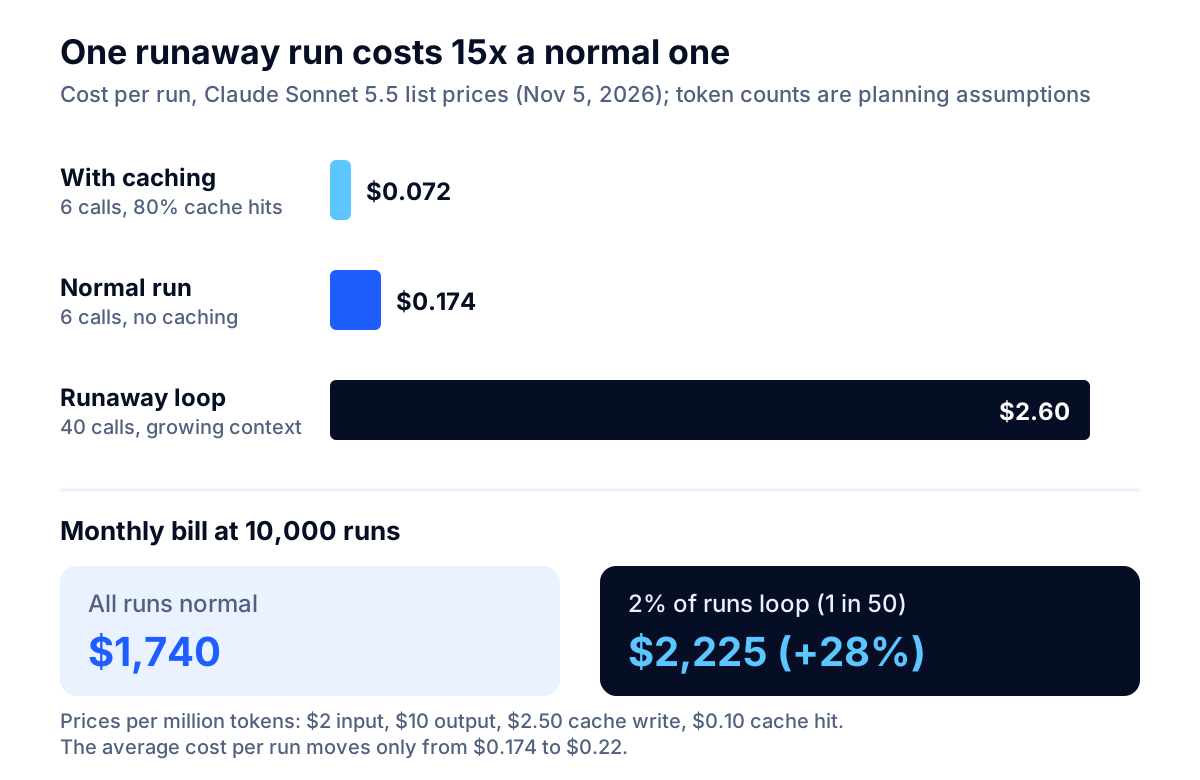
At 10,000 runs a month, the normal case costs about $1,740. If just 2% of runs (200) loop like the third row, the bill becomes 9,800 × $0.174 + 200 × $2.60 = about $2,225, a 28% increase caused by one run in fifty. The average cost per run rises only from $0.174 to $0.22, which is easy to miss on a dashboard that shows averages. That is why the scorecard alerts on any run above 5x the median and on the p95, and why a hard per-run budget belongs in the code.
Three practices keep cost monitoring honest:
- Reconcile with the provider's numbers. Your own token math can drift from the bill (a missed span, a retry outside the tracer). Anthropic's Usage and Cost API reports usage by model, workspace and API key in 1-minute, 1-hour or 1-day buckets, with data typically available within 5 minutes, and costs by day. Compare its daily total with your traces weekly.
- Give each agent its own API key or workspace, so provider-side reports split cost by agent without depending on your tracing.
- Watch cache hit rates. In the example above, caching cuts the cost per run by about 59%. A prompt change that breaks caching can double spend overnight with no change in traffic.
For the wider picture of allocating AI spend across teams, see our guide to FinOps for AI workloads, and for reducing the per-call cost once you can see it, our LLM API cost optimization guide. The anomaly detection methods in cloud cost anomaly detection apply to daily agent spend too.
How do you monitor answer quality without reading every transcript?
Combine four sources: outcome labels from your own systems, user feedback, automated evaluators on a sample of runs, and human review of a small, targeted queue. No single one is reliable alone.
- Outcome labels from systems of record are the cheapest and most trustworthy: the ticket stayed closed, the refund matched policy, the appointment exists in the calendar. Wire these back to the trace by run ID.
- User feedback (thumbs up or down, a follow-up complaint, a reopened ticket) is sparse but real. Microsoft's Foundry tracing supports attaching user feedback events to the trace of the response they rate.
- Automated evaluators (an LLM-as-judge or rule checks) scoring a sample of production runs for groundedness, policy compliance and tone. Sample rather than scoring everything: evaluators cost tokens too, and Microsoft notes that evaluations in its playground are billed.
- Human review queue: every escalated or failed run, every run an evaluator flags, and a small random sample of "successful" runs, because the failures you have not imagined hide there.
Turn what reviewers find into test cases. Every production failure should become a case in the evaluation set you run before each release; our guide on how to evaluate AI chatbot accuracy shows how to build that set and score it. Over a few months, the release gate catches the regressions that monitoring used to catch in production.
Native cloud tools or an LLM observability platform?
Start with what your cloud already gives you if your agent runs on AWS or Azure, and add a dedicated LLM observability platform when you need evaluation workflows, prompt versioning or cross-cloud views. Both accept OpenTelemetry, so the choice is reversible.
| Option | What you get | Price basis (as of November 2026) | Best fit |
|---|---|---|---|
| Amazon Bedrock AgentCore + CloudWatch | Automatic session metrics for AgentCore runtime agents; spans and traces in CloudWatch generative AI observability after enabling Transaction Search | CloudWatch rates, for example $0.50 per GB of standard log ingestion and $0.35 per GB of span ingestion (first 10 TB) | Agents hosted on AWS; teams already on CloudWatch |
| Microsoft Foundry + Application Insights | OpenTelemetry tracing for Foundry agents and major frameworks, user feedback on traces, evaluations | Azure Monitor and Foundry evaluation rates | Agents on Azure OpenAI or Foundry |
| Langfuse Cloud | Tracing, prompt management, evaluations; open source, self-hostable | Hobby free with 50,000 units a month; Core $29 a month with 100,000 units and 90 days of data access; $8 per extra 100,000 units | Small teams, cost-sensitive, self-hosting option |
| LangSmith | Tracing, evaluations, deployment; tight LangChain and LangGraph fit | Developer free (1 seat, 5,000 base traces); Plus $39 per seat a month with 10,000 base traces; base traces kept 14 days, extended 180 days | Teams building on LangChain or LangGraph |
| Datadog Agent Observability | LLM traces next to your APM, logs and infrastructure metrics | Free up to 40,000 LLM spans a month; Pro from $160 a month annual with 100,000 spans; $3.50 per extra 10,000 spans annual | Companies already standardized on Datadog |
Prices come from each vendor's pricing page (Langfuse, LangSmith, Datadog, Amazon CloudWatch), checked November 5, 2026. Each vendor counts differently: Langfuse bills units (every trace, observation and score), LangSmith bills traces (one per run), and Datadog bills LLM spans. Convert your expected runs and steps into each vendor's unit before comparing.
Questions to ask before you choose: Can it compute cost per run from your own price table? Can it redact fields before storage? How long does it keep traces on your plan? Can you export raw traces if you leave? Does it support the frameworks and models you use, including the next one?
What does AI agent monitoring cost?
For a typical small-business agent, monitoring costs a few percent of the model bill. The bigger cost is engineering time to instrument outcomes and build the review loop, not the tool subscription.
Take the support agent above at 10,000 runs a month. Each run produces about 15 tracing data points: one trace, one agent span, six model spans, five tool spans and one evaluator score or feedback event. That is 150,000 units, spans or data points a month, or 10,000 traces.
| Tool | How the 10,000 runs are counted | Estimated monthly cost |
|---|---|---|
| Langfuse Core | 150,000 units: $29 including 100,000, plus 50,000 extra at $8 per 100,000 | About $33 to $37 |
| LangSmith Plus | 10,000 base traces, included in Plus | $39 per seat (for example $117 for three seats) |
| Datadog Agent Observability Pro (annual) | About 150,000 spans: $160 including 100,000, plus 5 × $3.50 | About $178, if every span counts as an LLM span |
| CloudWatch (AgentCore) | Span ingestion by volume at $0.35 per GB | Under a dollar at about 2 KB per span without message content; more with full prompts stored |
Against a model bill of about $1,740 a month, that is 2% to 10%. For the runtime, tools and evaluation meters that sit alongside this on an AWS bill, see our AgentCore pricing breakdown. Two things push the cost up: storing full prompt and response content (it multiplies the size of every span) and longer retention. Both are also privacy decisions, covered next. Evaluator scoring is the other variable: if an LLM judge reads every run, it can cost a meaningful fraction of the agent itself, which is why sampling 5% to 20% of successful runs is a sensible starting point.
What should you not log? Privacy and retention
Log metadata for every run, and store message content only where you need it, redacted, access-controlled and deleted on a schedule. Traces of an agent that reads email, patient records or account data are themselves a sensitive data store.
The platforms default to caution. Microsoft's Foundry tracing records message content only when you set AZURE_TRACING_GEN_AI_CONTENT_RECORDING_ENABLED to true, and its documentation warns that the content might contain personal data. The OpenTelemetry tool span conventions mark gen_ai.tool.call.arguments and gen_ai.tool.call.result as opt-in for the same reason.
A workable policy for most companies:
- Always keep: IDs, versions, token counts, costs, durations, statuses, tool names, outcomes and scores.
- Keep content for: failed, escalated and flagged runs, plus a small random sample of successes, with names, account numbers and other identifiers redacted before export.
- Restrict access to traces with content to the people who debug the agent, and log who views them.
- Set retention with your compliance team: long enough to investigate complaints and audits, short enough not to become a liability. Note that some platforms separate "data access" windows from actual deletion; Langfuse, for example, keeps older data stored after the access window and offers deletion as a separate retention setting on higher plans.
- Check your contracts: if traces leave your cloud for a SaaS observability vendor, that vendor becomes a subprocessor for whatever data the traces contain.
Operational traces are not the same as a compliance audit trail. If you need a tamper-evident record of AI decisions for regulators or customers, see our article on AI audit trail requirements; healthcare teams should also read our HIPAA compliant AI development checklist.
A 30-day plan to get an agent properly monitored
You can go from "we look at the logs when someone complains" to the full scorecard in about a month, in four steps. Do them in this order, because each one depends on the one before.
Week 1: Trace everything. Add OpenTelemetry instrumentation (or your platform's SDK) for model and tool calls, a run span with run ID, agent version and prompt version, and per-span token counts. Turn on cost calculation from your price table. Do not capture message content yet.
Week 2: Label outcomes and set hard limits. Add the outcome attribute (completed, escalated, failed, abandoned) from your systems of record. Add maximum steps, per-run budget, timeouts and rate limits in code. Give each agent its own API key or workspace.
Week 3: Baseline and alert. Build the eight-signal dashboard, segmented by workflow. Record two weeks of baseline, then switch on the alert rules from the scorecard with named owners and one-page runbooks. Reconcile your trace-based cost with the provider's usage report.
Week 4: Close the quality loop. Start sampled evaluator scoring, a human review queue for escalations and flagged runs, and the policy for which content to keep. Move every confirmed failure into the pre-release evaluation set.
If your agent is still a pilot, monitoring is also how you earn the right to scale it; our guide to moving from AI pilot to production explains the other gates.
The bottom line on monitoring AI agents in production
Monitoring an AI agent comes down to four questions answered for every run: did it finish the job, what did it do, what did it cost, and did it try anything risky. Trace each step with the OpenTelemetry GenAI conventions (usable, though still in Development status as of November 2026), label outcomes in code, compute cost per run, and alert on completion drops, tool errors, loops and outlier sessions rather than averages. Expect the tooling to cost a few percent of the model bill; the real investment is the outcome labels and the review loop.
If you are planning an agent, or already running one you cannot see inside, our team that builds and operates it builds monitoring, budgets and approval steps in from the first prototype. You can talk to a specialist about your setup, or see everything we do on the Fleurant AI home page.
If you'd like one clear, practical take on AI, software and cloud decisions each month, subscribe to the Fleurant AI Briefing: one email a month, unsubscribe any time.
Frequently asked questions
What is the difference between AI agent monitoring and regular application monitoring?
Regular application monitoring tells you whether requests succeed and how fast they are. An agent can return HTTP 200 on every call while it loops, calls the wrong tool, invents an answer or spends ten times its normal budget. Agent monitoring adds a trace of every step (model calls, tool calls, retries), the tokens and cost of each step, and a measure of whether the task was actually completed. You need both: the infrastructure view and the per-run view.
What should I log for every AI agent run?
At minimum: a session or run ID, the agent name and version, the model and prompt version, every model call with input, output and cached token counts, every tool call with its name, status and duration, the number of steps and retries, the total cost, and the final outcome (completed, escalated to a human, failed, abandoned). Prompt and tool content are optional and should be redacted or sampled, because they can contain personal or confidential data.
Is OpenTelemetry ready for monitoring AI agents?
It is usable but not stable. As of November 2026 the OpenTelemetry GenAI semantic conventions, including the invoke_agent and execute_tool spans, are marked Development, and they moved to a separate semantic-conventions-genai repository. Microsoft Foundry, Amazon Bedrock AgentCore and most LLM observability tools already emit or accept them. Use them, but pin your instrumentation versions and expect attribute names to change before they reach Stable.
How do you calculate the cost of an AI agent session?
Add up, for every model call in the session, input tokens times the input price, cached tokens times the cache price and output tokens times the output price, then add any paid tool calls. With Claude Sonnet 5.5 at $2 input and $10 output per million tokens, a six-call session averaging 12,000 input and 500 output tokens per call costs about $0.17. Record this per session so you can alert when one run costs several times the median.
How much do LLM observability tools cost?
As of November 2026, Langfuse Cloud starts free (50,000 units a month) and Core is $29 a month with 100,000 units, then $8 per extra 100,000. LangSmith Plus is $39 per seat a month with 10,000 base traces included. Datadog's Agent Observability Pro starts at $160 a month on an annual plan with 100,000 LLM spans. For an agent handling 10,000 sessions a month, that is roughly $30 to $180 a month, usually a few percent of the model bill.
What alerts should an AI agent have?
Start with eight: a drop in task completion rate, a rise in human escalations, a tool error rate above baseline, sessions that exceed a step limit (loops), a single session costing several times the median, daily spend above budget, p95 latency regressions after a release, and any blocked or attempted high-risk action. Alert on patterns over a window, not on single failed requests, and tie each alert to a named owner and a runbook.
Should I store full prompts and responses in my traces?
Only when you need them and can protect them. Microsoft's Foundry tracing keeps message content off by default and warns it may contain personal data, and OpenTelemetry marks tool arguments and results as opt-in. A practical pattern is to store metadata for every run, full content for failed and escalated runs and a small sample of successes, with redaction, role-based access and a retention period your compliance team approves.
Sources
- Gartner Predicts Over 40% of Agentic AI Projects Will Be Canceled by End of 2027, Gartner
- Artificial Intelligence Risk Management Framework (AI RMF 1.0), NIST AI 100-1, National Institute of Standards and Technology
- Semantic conventions for GenAI agent and framework spans, OpenTelemetry (semantic-conventions-genai repository)
- Semantic conventions for GenAI inference spans, OpenTelemetry (semantic-conventions-genai repository)
- Semantic conventions for execute tool spans, OpenTelemetry (semantic-conventions-genai repository)
- Amazon Bedrock AgentCore generated observability data, Amazon Web Services
- Amazon CloudWatch pricing, Amazon Web Services
- Trace and observe AI agents in Microsoft Foundry, Microsoft Learn
- Pricing, Claude Platform Docs (Anthropic)
- Usage and Cost API, Claude Platform Docs (Anthropic)
- LLM10:2025 Unbounded Consumption, OWASP Gen AI Security Project
- Langfuse pricing, Langfuse
- LangSmith plans and pricing, LangChain
- Datadog pricing: Agent Observability, Datadog