Cloud Costs
Cloud Cost Anomaly Detection: How Fast AWS, Azure and GCP Alert
Cloud cost anomaly detection on AWS, Azure and Google Cloud compared as of November 2026: alert delays, thresholds, setup steps and the gaps to cover.

In this article
- What cloud cost anomaly detection does, and what it does not
- How fast does each cloud alert on a cost spike?
- How to set up AWS Cost Anomaly Detection
- How to set up anomaly alerts in Azure Cost Management
- How to set up Google Cloud cost anomaly detection
- Budgets, spend caps and anomaly alerts: which one stops spending?
- How to set anomaly thresholds without drowning in alerts
- Multi-cloud anomaly detection: native, do-it-yourself or a platform?
- The anomaly runbook: what to do in the first hour
- When native anomaly detection is enough, and when it is not
- Turn it on today, then close the gaps
- Frequently asked questions
- Sources
Cloud cost anomaly detection is free and built into AWS, Azure and Google Cloud, and you should turn it on everywhere today. But know its real limit before you rely on it: none of the three native tools alerts in real time. As of November 2026, AWS can take up to about 24 hours to flag a spike, Azure 36 to 60 hours, and Google Cloud reports standard anomalies the next day. A runaway workload keeps billing the whole time, and no anomaly alert stops it.
This guide gives you what the provider docs scatter across a dozen pages: how fast each cloud actually alerts, how to set each one up in under an hour, how to pick thresholds that people will not learn to ignore, which tools can actually stop spending, and a five-step runbook for the first hour after an alert. Every number below was checked on the provider's own documentation in November 2026.
Key takeaway: Anomaly detection tells you that something changed, usually a day or more later. Budgets with actions, spend caps and quotas are what limit the damage. You need both, and you need a named person who reads the alert.
What cloud cost anomaly detection does, and what it does not
Cloud cost anomaly detection compares your actual spend against a forecast built from your own history and alerts when the difference is larger than normal. It is a statistical early-warning system, not a spending limit, and it only sees the cloud it runs in.
The three native tools share a design. Each one learns a baseline from past spend, accounts for patterns such as weekday peaks and steady growth, scores each day (or part of a day) against that baseline, and points you at the likely cause. The details differ in ways that matter:
- AWS Cost Anomaly Detection uses machine learning on your net unblended cost, that is, cost after discounts, and ranks root causes by dollar impact across four dimensions: service, account, Region and usage type, according to the AWS Cost Anomaly Detection guide.
- Azure Cost Management anomaly detection compares each subscription's daily usage to a forecast trained on the last 60 days. Microsoft's anomaly documentation describes the model as a univariate, unsupervised time-series model using a deep learning algorithm called WaveNet.
- Google Cloud Cost Anomaly Detection watches every project linked to a billing account and shows the top services, regions and SKUs behind a spike, per Google's anomaly documentation. It became generally available on November 3, 2025, when Google switched alerts on by default for all customers and added AI-generated thresholds.
What none of them does: stop a resource, cap a bill, see another cloud, or see your SaaS and AI vendor invoices. They also need history. A brand-new service or monitor has little or nothing to compare against, which is exactly when mistakes are most likely.
The FinOps Foundation treats this as a full capability, Anomaly Management, not a tool: detect, route to the people who can act, investigate, resolve and document. Its "crawl" stage is a central team checking reports by hand and reacting more than a week later. Its "walk" stage is automated detection with alerts routed to the responsible team. Most small and mid-sized companies can reach "walk" in an afternoon with the free native tools.
How fast does each cloud alert on a cost spike?
The short answer is: hours to days, not minutes. Detection waits for billing data, and billing data is always late. The table below shows the worst-case delay from usage to first alert, derived from each provider's documented data delays and run schedules.
| Native tool (as of November 2026) | Worst-case time from usage to first alert | What drives the delay | Source |
|---|---|---|---|
| Google Cloud early anomalies (Gemini API, Vertex AI; preview) | 20–40 minutes | Uses near-real-time estimated costs, service-level, daily insights | Google Cloud |
| AWS Cost Anomaly Detection, individual alerts | Up to about 24 hours | Cost Explorer data lags up to 24 hours; detection runs about three times a day | AWS |
| AWS daily summary email | Up to about 48 hours | Summary is generated at 00:00 UTC for the previous day's anomalies | AWS |
| Google Cloud standard anomalies | Next day | Reported "using standard next-day channels"; exact timing not published | Google Cloud |
| Azure anomaly alert email | About 36–60 hours | Runs 36 hours after the end of each UTC day, once per day | Microsoft Learn |
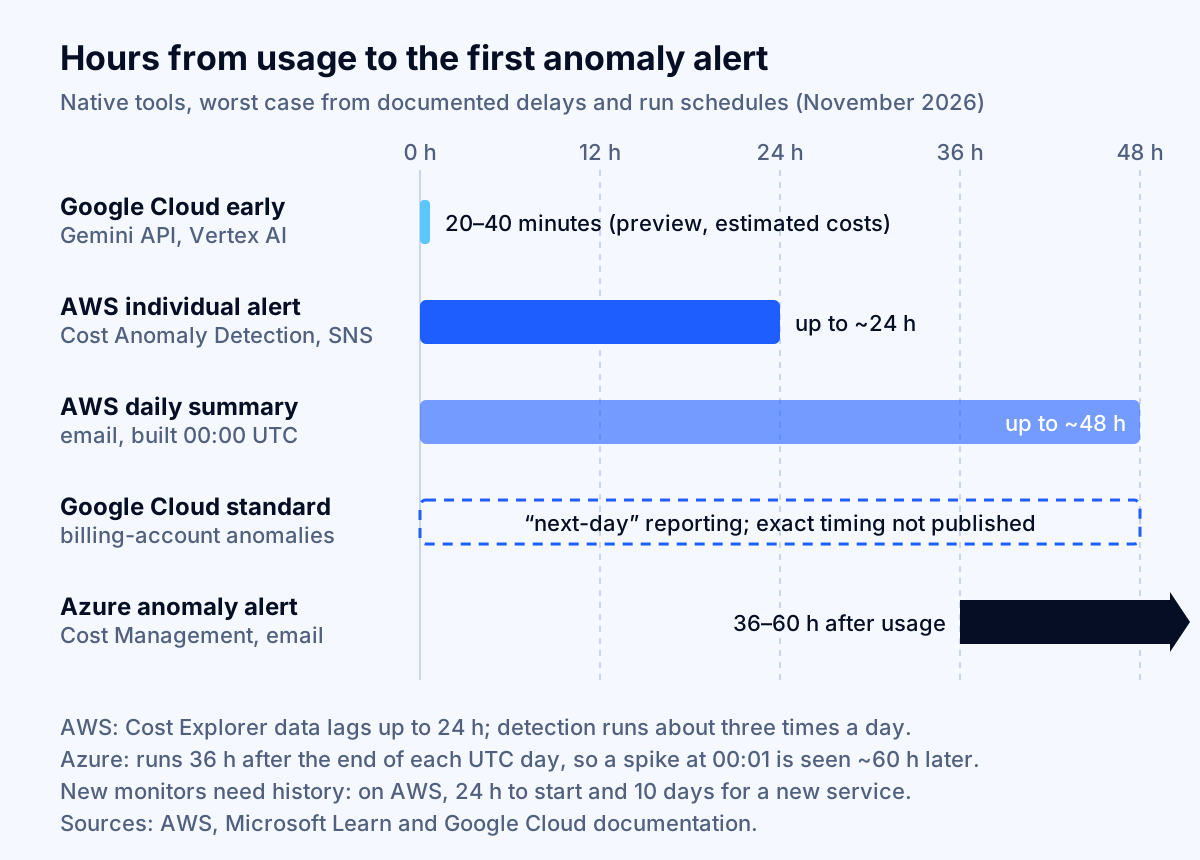
The Azure number deserves a closer look because it surprises people. Detection for a given day runs 36 hours after that day ends in UTC. A spike that starts at 00:01 UTC on Monday belongs to Monday's total, which is evaluated around noon UTC on Wednesday: roughly 60 hours later. A spike at 23:59 UTC is seen about 36 hours later.
What a slow alert costs you
Detection delay turns directly into money. A simple, illustrative calculation: a forgotten GPU instance or a looping job that adds $40 an hour to your bill costs $960 a day. At AWS's worst-case window of about 24 hours, that is roughly $960 spent before the first alert. At Azure's worst case of about 60 hours, it is about $2,400. Add the time it takes a person to read the email and act, and a weekend can double it.
That is why the fastest alert is not the only lever that matters. The more expensive a single mistake can get per hour, the more you need controls that act before billing data arrives: quotas, budget actions, spend caps, and limits in your own code. We cover those below.
What about brand-new accounts and services?
New things are where anomaly detection is weakest. On AWS, a new monitor can take 24 hours to start detecting, and a newly used service needs 10 days of usage history before anomalies can be detected for it. Azure needs a subscription to be onboarded in Cost Analysis, then starts showing anomaly status within 24 hours, and a new subscription can take up to 48 hours before Cost Management features are available at all, per Microsoft's budget tutorial. Google Cloud is the exception: its GA release extended detection to new accounts and projects with no prior spend history, where the preview had required projects to be at least 6 months old.
For a new account or a new product launch, set a fixed budget alert on day one. It does not need history.
How to set up AWS Cost Anomaly Detection
AWS Cost Anomaly Detection is set up in the Billing and Cost Management console in about 15 minutes. You create a monitor (what to watch) and an alert subscription (who hears about it, how often and above what threshold).
Many accounts already have a starting point. According to the AWS Cost Anomaly Detection FAQs, new Cost Explorer customers with payer or regular accounts get an AWS services monitor and a daily email alert subscription automatically, with default alerts for anomalies above 40% of expected spend and at least $100 of impact. Check whether yours exists before creating duplicates.
Step 1: choose AWS managed monitors for coverage
AWS offers two monitor methods, explained in the getting started guide:
- AWS managed monitors track every value in a dimension independently and pick up new ones automatically: all AWS services, all linked accounts (management account only), all values of a cost allocation tag, or all values of a cost category. They track up to 5,000 values; above that, the top 5,000 by spend.
- Customer managed monitors (formerly "custom monitors") track up to 10 values you choose, aggregated together. Use them when one group needs its own threshold, such as a production account or a high-spend team.
A sensible small-company setup is one AWS managed AWS services monitor plus one AWS managed linked account monitor if you use AWS Organizations, or one AWS managed cost allocation tag monitor on your team or product tag if your tagging is reliable. AWS advises against monitors that span several dimensions, because they produce duplicate alerts. Note that monitors for linked accounts, tags and cost categories can only be created in the management account.
Step 2: use individual alerts, not just the daily summary
The alert frequency matters more than most teams realize:
- Individual alerts fire as soon as an anomaly is detected and require an Amazon SNS topic. You can map the topic to Slack or Amazon Chime through Amazon Q Developer in chat applications.
- Daily summaries email the top 10 alerts from the previous day, generated at 00:00 UTC. An anomaly found at 04:30 UTC waits until the next midnight.
- Weekly summaries send one email a week. Useful for leadership, useless for stopping a spike.
Use individual alerts routed to a channel someone watches, and keep a daily or weekly summary for finance. If you want automation, Cost Anomaly Detection also publishes an Anomaly Detected event to Amazon EventBridge with the impact, root causes and a link to the anomaly, documented in the EventBridge integration guide. That event can open a ticket or trigger a Lambda function.
Step 3: set two thresholds
AWS supports absolute (dollar impact) and percentage (impact versus expected spend) thresholds, and you can combine two with AND or OR. Alerts keep coming every day an ongoing anomaly stays above threshold, and anomalies below the threshold still appear on the Detected anomalies tab for 90 days by default. More on choosing the numbers in the thresholds section below.
AWS gaps to know
- Marketplace: Cost Anomaly Detection does not monitor third-party products bought through AWS Marketplace, except third-party foundation models on Amazon Bedrock. Use an AWS Budgets cost budget with the Billing entity filter for the rest.
- Billing transfer: it is not available for bill source accounts that use billing transfer.
- Visibility: monitors and subscriptions are only visible in the account that created them, so centralize them in the management account.
If your AWS bill already looks wrong, our guide to why an AWS bill is so high walks through finding the charge in Cost Explorer, line by line.
How to set up anomaly alerts in Azure Cost Management
Azure anomaly detection is on by default for any subscription you open in Cost Analysis, but the alert email is not. You have to create an anomaly alert rule for each subscription.
Microsoft's anomaly guide lays out the steps: open Cost Management, select the subscription scope, choose Cost alerts, select + Add, choose Anomaly as the alert type and enter recipients. Creating the rule requires the Cost Management Contributor role or higher.
The Azure-specific rules that trip people up:
- Subscription scope only. Anomaly alert rules can only be created per subscription, with a limit of five per subscription. There is no management-group or billing-account anomaly alert, so a company with 30 subscriptions needs 30 rules. Automate them with the Scheduled Actions API, using the
InsightAlertkind, and add the step to your subscription-creation checklist. - One email per anomaly. The alert is sent once, at detection. There are no reminders while the spike continues.
- The creator's access matters. Alerts are sent based on the rule creator's current access when the email goes out. If that person leaves or loses the Reader role, the alerts silently stop. Microsoft suggests creating rules with a service principal for this reason.
- Email only. Native delivery is email. Microsoft's documented automation patterns are a Logic App watching a mailbox, Microsoft Sentinel ingesting the emails, or an ITSM tool such as ServiceNow, Jira or Zendesk turning a shared mailbox into tickets.
- Public cloud only. Anomaly alerts are not available for Azure Government or other sovereign clouds.
When an alert arrives, the email summarizes the change in resource group count and cost, lists the top resource group changes against the previous 60 days, and links into the portal. From there, drill down by resource group, resource and finally meter; the meter name tells you the actual charge. Our Azure cost optimization checklist puts anomaly alerts in the first 30 days of a wider 90-day plan.
How to set up Google Cloud cost anomaly detection
Google Cloud cost anomaly detection needs the least setup: since general availability, it is on for every project and emails Cloud Billing admins about every individual anomaly by default. Your work is routing and thresholds.
According to Google's anomaly documentation, a Billing Account Administrator can:
- Set thresholds for standard anomalies: a cost-impact amount in the billing account's currency and a deviation percentage. Google sets them automatically from your usage patterns, and you can override them. Anomalies filtered out by thresholds are still visible on the dashboard.
- Choose recipients: Billing admins, Essential Contacts (individual alerts per project and daily summaries per organization) and project owners (individual alerts for their projects only). Settings apply to all projects on the billing account; you cannot pick a subset.
- Send to Pub/Sub so alerts can feed chat, ticketing or automation. The topic's project must allow external domain sharing, which may need an exemption from the
iam.allowedPolicyMemberDomainsorganization policy.
Early anomalies for AI workloads
Google's most interesting addition is early anomalies for the Gemini API and Vertex AI, in preview as of November 2026. They use near-real-time cost estimates and alert with an expected latency of 20 to 40 minutes from the time of usage, showing the project and the top three SKUs behind the spike. Google positions them partly as a way to catch fraud or abuse, such as a leaked API key. The costs are estimates that do not appear in cost reports, thresholds for early anomalies are system-defined and cannot be changed, and broad project-level anomalies still arrive through the next-day channel.
Google Cloud gaps to know
- Gross cost basis. Anomaly costs are gross: they include spend-based committed use discounts but exclude resource-based CUD credits, promotional credits and sustained use discounts. Expect anomaly amounts not to match your invoice.
- Resellers. Reseller accounts and subaccounts see anomalies only for their own projects or after switching to the subaccount.
- Project-level users can view anomalies but cannot change thresholds.
AI spend is where these alerts earn their keep fastest; our guide to FinOps for AI workloads covers the token, GPU and commitment metrics worth alerting on.
Budgets, spend caps and anomaly alerts: which one stops spending?
Only automation stops spending. Anomaly alerts and standard budgets notify; budget actions, action groups and spend caps act. Each cloud states this plainly. Microsoft: when a budget threshold is met, "resources aren't affected, and your consumption isn't stopped." AWS: you "might incur additional costs or usage that exceed your budget notification threshold" before AWS Budgets can notify you. Google: an alerts-only budget does not automatically cap usage or spending.
| Control (as of November 2026) | AWS | Azure | Google Cloud |
|---|---|---|---|
| Anomaly alert | Cost Anomaly Detection, email or SNS, EventBridge event | Anomaly alert rule per subscription (up to five), email | Cost Anomaly Detection, email or Pub/Sub |
| Budget alert timing | Updated up to three times a day, typically 8–12 hours apart | Data arrives in 8–24 hours; evaluated every 24 hours | First alert can take several hours; Pub/Sub updates several times a day |
| Forecasted alert | Yes | Yes | Yes, except custom date-range budgets |
| Automated response | Budget actions: apply an IAM policy or SCP, or stop specific EC2 or RDS instances, automatically or after approval | Budget can call an action group (subscription and resource group scopes), which can run Functions, webhooks or runbooks | Pub/Sub can drive automation such as disabling billing on a project |
| Native spending cap | None | Only the spending limit on credit-based subscriptions; not available with pay-as-you-go or commitment plans | Spend cap budgets for eligible services (Gemini API, Vertex AI, Cloud Run, Cloud Run functions) |
Sources: AWS Budgets, AWS budget actions, Azure budgets, Google Cloud budgets, Google Cloud spend caps.
Google Cloud spend caps, read the fine print
Google's spend cap budgets are the closest thing to a native kill switch on any of the three clouds, and they are narrow by design. Each cap covers one project and one eligible service, on a monthly period. When gross, estimated list-price costs pass 100% of the budget, new usage of that service in that project is paused until someone lifts the cap manually; alerts go out at 50%, 80% and 100%. Google is explicit that enforcement "isn't instant," overages are billed as normal, in-flight requests finish and are charged, and persistent resources such as compute and storage keep billing. Use caps on experimental AI and serverless projects, not as a replacement for anomaly alerts.
The practical pattern
Pair each anomaly monitor with a budget on forecasted spend, and attach an automated action only where stopping is safe: a dev or sandbox account, an experimental AI project, a batch environment. Never auto-stop production on a cost signal without a human in the loop; AWS budget actions support manual approval for exactly that reason.
Key takeaway: Anomaly detection is the smoke alarm. Budget actions and spend caps are the sprinkler, and they belong where an outage is cheaper than the bill.
How to set anomaly thresholds without drowning in alerts
Set the dollar threshold first, at the smallest daily overspend someone would actually stop work to fix, then add a percentage threshold to filter out noise from small services. Alerts that nobody acts on train people to ignore alerts, which is worse than having none.
A practical way to pick the numbers:
- Start from your bill. Take average daily spend over the last 30 days. A company spending $1,500 a day might decide that a $150-a-day surprise (10%) is worth a look.
- Use AND for the general channel. For example, "impact at least $150 and at least 20%". Large services must move a lot of dollars; small services must move a lot in relative terms and in dollars.
- Use OR for crown-jewel scopes. For a production account or an AI project with a public API key, alert on either condition, so a large dollar move or a sharp relative move both page someone.
- Separate audiences. Engineering gets individual alerts per team or product; finance gets a daily or weekly summary. AWS lets you attach several subscriptions to one monitor; Google lets you choose recipients by role.
- Review monthly. Open the detected anomalies list, look at what fell below threshold, and mark false positives. AWS and Google both take feedback ("Not an issue" or "Accurate anomaly" on AWS) to tune their models.
These numbers are illustrations of the method, not recommendations for your environment. The right threshold depends on your daily spend, how spiky it normally is, and how expensive an hour of a runaway resource can get.
Expect these false positives
Planned changes look like anomalies to a model. Common ones: a product launch or load test, a new environment, end-of-month batch jobs the model has not yet learned, a commitment purchase or renewal changing the cost basis, and price changes. The FinOps Foundation's Anomaly Management guidance recommends warning stakeholders before planned launches that are likely to trigger alerts and documenting those alerts when they occur. A shared launch calendar and a one-line note in the alert channel ("expected: load test in staging until Thursday") does the job.
Multi-cloud anomaly detection: native, do-it-yourself or a platform?
For most companies on two or three clouds, the right starting point is all three native detectors, each fully configured, routed into one shared channel. That costs nothing and catches large spikes. Build or buy something more only when a specific gap hurts.
The native tools leave four gaps in a multi-cloud setup:
- No single queue. Three alert formats, three consoles, three sets of thresholds.
- Uneven speed. Azure's 36–60 hour window is the weakest link, and AI vendor bills such as model API invoices are not covered at all.
- Coarse ownership. Alerts land at service, account or subscription level; mapping them to a team needs consistent tags or labels across clouds.
- No cross-cloud context. A workload migrating from one cloud to another looks like an anomaly in both: a drop in one, a spike in the other.
Option 1: route native alerts into one place
The cheapest fix. Send AWS EventBridge events, Google Pub/Sub messages and Azure alert emails (via a Logic App or a monitored mailbox) into one Slack or Teams channel, or one ticket queue, with a shared format: cloud, scope, impact in dollars, top cause, link, owner. This takes days, not months, and solves the "nobody saw it" problem.
Option 2: build your own detection on normalized billing data
The FinOps Foundation's FOCUS specification, now at version 1.4, normalizes billing data across clouds and other vendors, and AWS, Microsoft and Google Cloud are all listed as FOCUS data generators. Google Cloud can export billing data to BigQuery, including a FOCUS export in preview; loading the export is free, but you pay BigQuery storage and query charges. With all clouds in one table, a daily job can compare each team's spend to its trailing baseline and alert on your own rules, such as cost per customer or tokens per task. It is worth it when you need alerts by product, customer or unit cost that the native tools cannot express. It is not worth it just to rebuild what the clouds already give you for free.
Option 3: a third-party FinOps platform
Commercial cost platforms ingest bills from several clouds and SaaS vendors and run their own anomaly detection on top. They make sense when you need one view across many vendors, chargeback by team, and someone else to maintain the pipelines. Before you pay, check two things against your own data: how soon after usage the platform actually alerts (it still depends on provider billing data), and whether it saw the last three spikes you already know about. Our guide on whether cloud cost optimization tools work covers how to evaluate these vendors' savings claims.
The anomaly runbook: what to do in the first hour
An alert without a runbook becomes an email nobody owns. Write these five steps into your incident process, name an owner for each cloud, and measure how long each anomaly takes from alert to resolution.
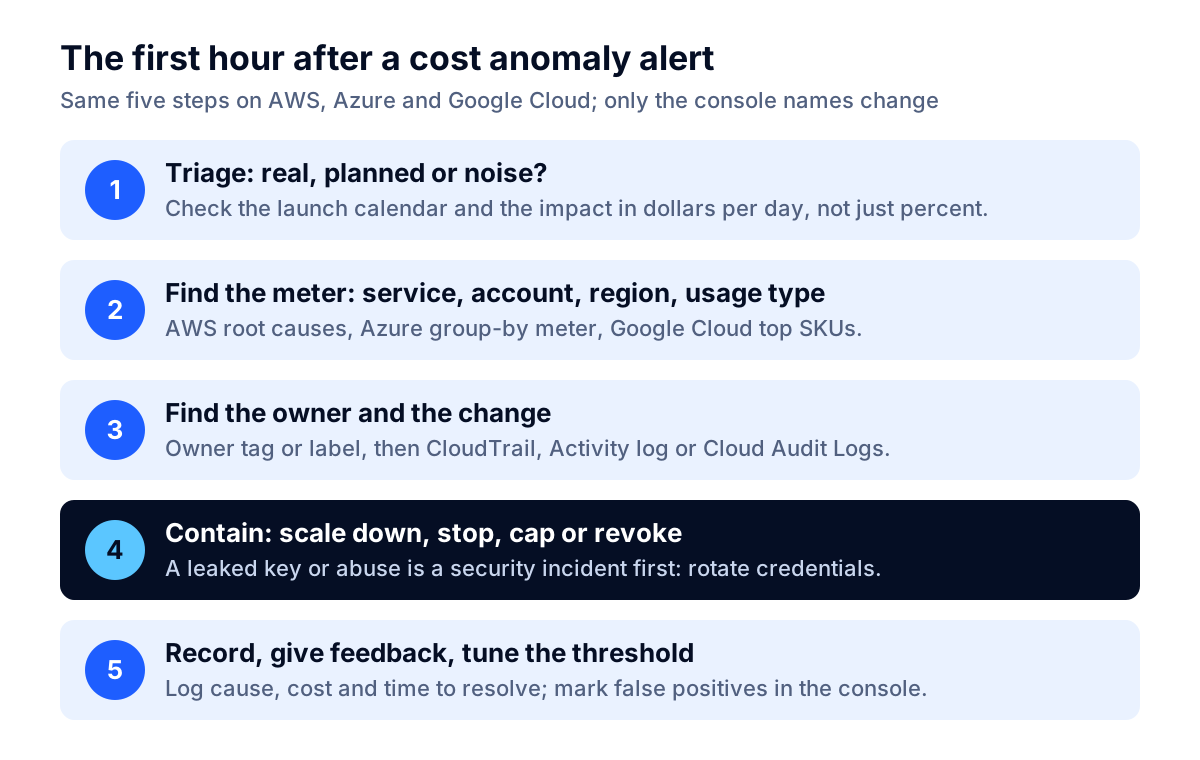
- Triage (first 15 minutes). Is it real, planned or noise? Check the launch calendar and look at the dollar impact per day, not just the percentage. A 300% jump on a $2-a-day service can wait; a 15% jump on a $5,000-a-day database cannot.
- Find the meter. On AWS, open the anomaly's root causes (service, account, Region, usage type). On Azure, group cost analysis by resource group, then resource, then meter, and look at two days around the spike, because a change made mid-day only shows its full cost on the next full day. On Google Cloud, use the top services, regions and SKUs, then the linked billing report.
- Find the owner and the change. Read the owner tag or label. If there is none, use the audit trail: AWS CloudTrail, the Azure Activity log and Resource Graph change history, or Google Cloud Audit Logs show who created or changed the resource.
- Contain. Scale down, stop, apply a quota, enable a spend cap, or pause the job. If the cause looks like abuse, such as a leaked API key generating model calls or crypto-mining instances in an unused Region, treat it as a security incident first: revoke and rotate the credentials, then deal with the cost.
- Record and tune. Log the cause, the dollars, and the time from usage to alert and from alert to fix. Mark false positives in the console. Adjust the threshold if the alert was noise.
The FinOps Foundation suggests tracking measures such as mean time to detect, mean time to notify the owner, time to resolve, cost avoided by acting before the bill arrives, and the share of anomalies handled through automation. For a small company, three are enough: how many anomalies you had, how long they took to fix, and how many were noise.
A one-page setup checklist
| # | Task | Where | Done when |
|---|---|---|---|
| 1 | AWS managed services monitor plus linked account or tag monitor | AWS Cost Anomaly Detection (management account) | Every account and new service is covered automatically |
| 2 | Individual alerts via SNS to a team channel; summary to finance | AWS alert subscriptions | A test message reaches the channel |
| 3 | Anomaly alert rule on every subscription, created by a service principal | Azure Cost Management, Scheduled Actions API | Rule count equals subscription count |
| 4 | Thresholds and Pub/Sub route set; Essential Contacts configured | Google Cloud Billing, Anomalies | Alerts reach the shared channel, not only billing admins |
| 5 | Forecasted budget on every account, subscription and project | AWS Budgets, Azure budgets, Google Cloud budgets | No scope without a budget |
| 6 | Automated actions or spend caps on sandbox, dev and AI experiment scopes | Budget actions, action groups, spend caps | A runaway test cannot run all weekend |
| 7 | Owner tags or labels enforced on new resources | AWS tag policies, Azure Policy, Google Cloud labels | Every alert maps to a team |
| 8 | Runbook and monthly 30-minute review on the calendar | Your incident tool | Anomalies are logged with cause, cost and time to fix |
When native anomaly detection is enough, and when it is not
Native detection is enough when your daily spend is modest, one cloud dominates, your accounts are organized by team, and the worst plausible runaway costs less per day than an engineer's time to build something better. Configure it fully, route it well, and review it monthly. That is the whole job.
It is not enough when:
- One mistake can cost thousands per hour, as with large GPU clusters, model APIs exposed to the public, or data transfer at scale. You need controls that act before billing data arrives: quotas, rate limits, spending limits at the model provider where offered, and caps in your own code.
- You need answers by customer, feature or unit cost. That requires your own data pipeline joined with application metrics.
- Azure is a big share of spend and a 36–60 hour detection window is too slow. Add budgets with forecasted alerts and usage-based Azure Monitor alerts on the most expensive resources.
- Alerts go to nobody. No tool fixes ownership. If alerts land in a former employee's inbox, start there.
Turn it on today, then close the gaps
Cloud cost anomaly detection costs nothing on AWS, Azure or Google Cloud, and every company should have it running on every account, subscription and billing account by the end of the week. Just do not mistake it for protection: it alerts hours to days after usage, and it never stops spending. Pair it with forecasted budgets, automated actions or spend caps where stopping is safe, and a five-step runbook with a named owner.
If you want help setting this up across clouds, or finding out why the last spike happened, Fleurant AI's cloud cost optimization team works with AWS, Azure and Google Cloud certified engineers, and a free discovery call is a good place to start. You can also explore all of our services, or read our guide to LLM API cost optimization if model spend is your fastest-growing line.
Frequently asked questions
Is cloud cost anomaly detection free on AWS, Azure and Google Cloud?
Yes, the native tools carry no separate charge. Microsoft states there is no charge to use Cost Management and Billing features for Azure subscriptions, Google says its Cost Anomaly Detection remains free, and AWS describes its default anomaly setup as available with no effort or cost. What can cost money is what you build around them: an SNS topic and chat integration on AWS, Pub/Sub and BigQuery queries on Google Cloud, or a Logic App that parses Azure alert emails.
How quickly will I be alerted to a cloud cost spike?
Usually not the same day. AWS Cost Anomaly Detection relies on Cost Explorer data that lags up to 24 hours and runs about three times a day. Azure evaluates each day 36 hours after it ends in UTC, so a spike that starts just after midnight can take about 60 hours to reach your inbox. Google Cloud reports standard anomalies the next day; only its preview early anomalies for the Gemini API and Vertex AI arrive within 20 to 40 minutes.
Does a budget or anomaly alert stop cloud spending?
No. Anomaly alerts and standard budgets only notify. Microsoft states that when a budget threshold is met, resources aren't affected and consumption isn't stopped, and AWS warns you might exceed a threshold before its notification arrives. To stop spending you need automation: AWS budget actions that apply an IAM policy or SCP or stop EC2 and RDS instances, Azure budgets that call an action group, or Google Cloud spend cap budgets for a few eligible services.
What threshold should I set for cost anomaly alerts?
Set a dollar threshold equal to the smallest daily overspend you would act on, then add a percentage threshold so tiny services do not page you. AWS's default alert subscription uses anomalies above 40% of expected spend and at least $100 of impact. Combine the two with AND for a quieter channel, use OR for a high-priority production account, and review the detected anomalies list monthly to tune the numbers.
Can AWS Cost Anomaly Detection monitor AWS Marketplace charges?
Mostly no. AWS documents that Cost Anomaly Detection does not monitor third-party products and services bought through AWS Marketplace, with one exception: third-party foundation models on Amazon Bedrock, which appear under the AWS Marketplace billing entity. For other Marketplace spend, AWS recommends a cost budget, using the Billing entity filter to track Marketplace charges specifically.
Do I need a third-party tool for multi-cloud cost anomaly detection?
Not at first. Each cloud's native detector is free and good enough to catch large spikes, as long as every account, subscription and billing account is covered and alerts route to someone who acts. A third-party platform or a custom pipeline earns its keep when you need one alert queue across clouds, faster detection than the native schedules, alerts per team or product, or coverage of SaaS and AI vendors the clouds cannot see.
Sources
- Detecting unusual spend with AWS Cost Anomaly Detection, AWS Billing and Cost Management User Guide
- Getting started with AWS Cost Anomaly Detection, AWS Billing and Cost Management User Guide
- AWS Cost Anomaly Detection FAQs, Amazon Web Services
- Using EventBridge with Cost Anomaly Detection, AWS Billing and Cost Management User Guide
- Managing your costs with AWS Budgets, AWS Billing and Cost Management User Guide
- Configuring budget actions, AWS Billing and Cost Management User Guide
- Identify anomalies and unexpected changes in cost, Microsoft Learn
- Tutorial: Create and manage budgets, Microsoft Learn
- View and manage cost anomalies, Google Cloud Billing documentation
- Announcing the GA of Cost Anomaly Detection, Google Cloud Blog
- Create, edit, or delete budgets and budget alerts, Google Cloud Billing documentation
- Manage spend cap budgets, Google Cloud Billing documentation
- Export Cloud Billing data to BigQuery, Google Cloud Billing documentation
- Anomaly Management capability, FinOps Foundation
- Azure spending limit, Microsoft Learn
- FOCUS: the FinOps Open Cost and Usage Specification, FinOps Foundation


