Cloud Costs
Why Is My AWS Bill So High? Find the Cause in an Hour
Why is my AWS bill so high? A triage sequence using Cost Explorer and usage types, a verified idle-cost baseline, and the fix for each of the nine usual suspects.
In this article
- First, decide whether your bill jumped or has always been high
- The zero-traffic baseline: what an empty AWS account still costs
- How to find the cause in one sitting
- Decode the usage types that actually appear on your bill
- The nine usual suspects, and the fix for each
- Is the fix worth your engineer's time?
- Guardrails so it does not happen again
- Rate optimization: what Savings Plans do and do not fix
- When not to optimize
- What to do this week
- Frequently asked questions
- Sources
If you are asking why is my AWS bill so high, the answer is almost always one of two things, and they need different responses. Either your bill jumped — something changed, and you need to find which line item moved and on what day. Or your bill never jumped and the number has simply always been higher than it feels like it should be, in which case the problem is the shape of your architecture, not an accident.
This article gives you both. First, a triage sequence that takes under an hour and works around the delays built into every AWS cost tool — the main reason people hunt for a spike and come back empty-handed. Second, a baseline table showing what a modest, conventionally built AWS environment costs with no users at all, computed from AWS list prices in US East (N. Virginia) as of October 2026. Then the nine charges that account for most surprises, with the specific rate for each and the specific fix.
Every price here comes from an AWS pricing page or AWS documentation, linked in the sources. Prices change and vary by Region, so treat the figures as a shape to compare your own bill against, not a quote.
Key takeaway: Group Cost Explorer by Usage Type, not by Service. "EC2-Other went up $900" tells you nothing. "NatGateway-Bytes went up $900" tells you exactly what to fix.
First, decide whether your bill jumped or has always been high
These are different problems, and conflating them wastes a day.
Open Cost Explorer, set the granularity to Monthly, group by Service, and look at the last six months. You are looking for the shape of the line, not the total.
- A step change in one or two services means a configuration, deployment or traffic event. Go to the triage sequence below.
- A steady upward slope that tracks your usage means your unit economics are working as designed. The lever is architecture and commitments, not a bug hunt.
- A flat number that is simply bigger than you expected means you are paying for the scaffolding around your application. That is the baseline problem, and the table in the next section is the fastest way to confirm it.
- A line that is flat and then steps up once, permanently, very often means a free tier or a credit ran out, not that anything changed on your side.
One caution before you start: Cost Explorer refreshes your cost data at least once every 24 hours, so today's charges are not fully there yet. If you are looking at a bill that spiked this morning, you may simply be too early. Use the last complete day as your most recent data point.
The zero-traffic baseline: what an empty AWS account still costs
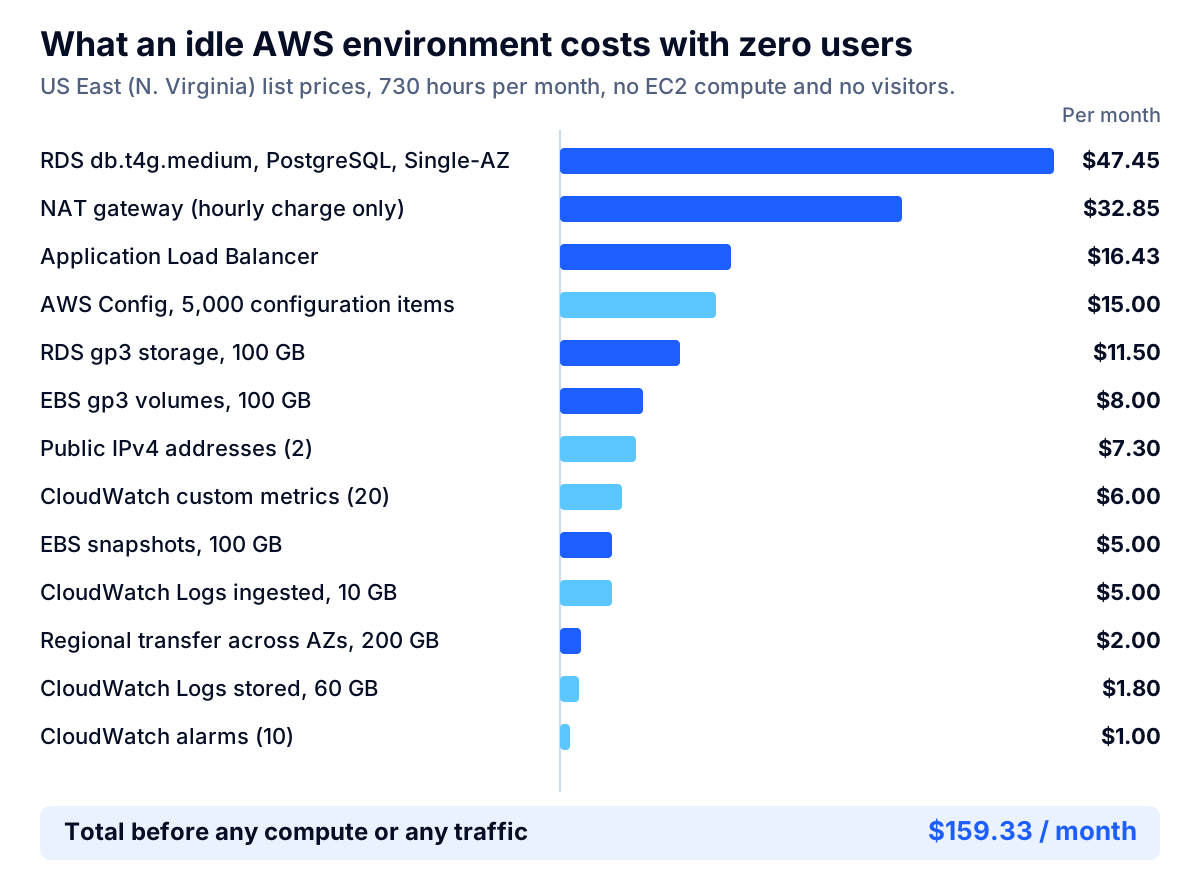
This is the most useful number for anyone whose bill feels disproportionate to their traffic. The table below prices a modest, textbook three-tier setup in US East (N. Virginia) carrying no user traffic at all and running no EC2 instances. Every rate comes from AWS's own pricing, and every line assumes 730 hours where an hourly charge applies.
| Line item | Quantity | Rate | Per month |
|---|---|---|---|
RDS db.t4g.medium, PostgreSQL, Single-AZ |
730 hours | $0.065 / hour | $47.45 |
| NAT gateway, hourly charge only | 730 hours | $0.045 / hour | $32.85 |
| Application Load Balancer | 730 hours | $0.0225 / hour | $16.43 |
| AWS Config, configuration items recorded | 5,000 items | $0.003 / item | $15.00 |
| RDS gp3 storage, Single-AZ | 100 GB | $0.115 / GB-month | $11.50 |
| EBS gp3 volumes | 100 GB | $0.08 / GB-month | $8.00 |
| Public IPv4 addresses | 2 | $0.005 / hour each | $7.30 |
| CloudWatch custom metrics | 20 | $0.30 / metric-month | $6.00 |
| EBS snapshots, standard tier | 100 GB | $0.05 / GB-month | $5.00 |
| CloudWatch Logs ingested, Standard class | 10 GB | $0.50 / GB | $5.00 |
| Regional data transfer across AZs | 200 GB | $0.01 / GB | $2.00 |
| CloudWatch Logs stored | 60 GB | $0.03 / GB-month | $1.80 |
| CloudWatch alarms, standard resolution | 10 | $0.10 / alarm-month | $1.00 |
| Total before any compute or any visitors | $159.33 |
Assumptions: 730 hours per month; US East (N. Virginia) list prices as of October 2026; no Savings Plans or Reserved Instances; no free tier credits applied. The 200 GB of regional transfer is 100 GB of cross-Availability-Zone traffic billed on both the sending and the receiving side at $0.01 per GB.
Now add two small EC2 instances, a second NAT gateway because someone followed the high-availability guidance, Multi-AZ on the database, and a few hundred gigabytes of logs. You are near $400 a month with a handful of internal users and nothing has gone wrong. That is the honest answer to "my MVP has no users and costs $415": the MVP is not the expensive part.
Key takeaway: For a small environment, the fixed scaffolding — load balancer, NAT gateway, public IP addresses, storage, snapshots, logs, Config — usually costs more than the compute. Cutting instance sizes will not fix a scaffolding bill.
How to find the cause in one sitting
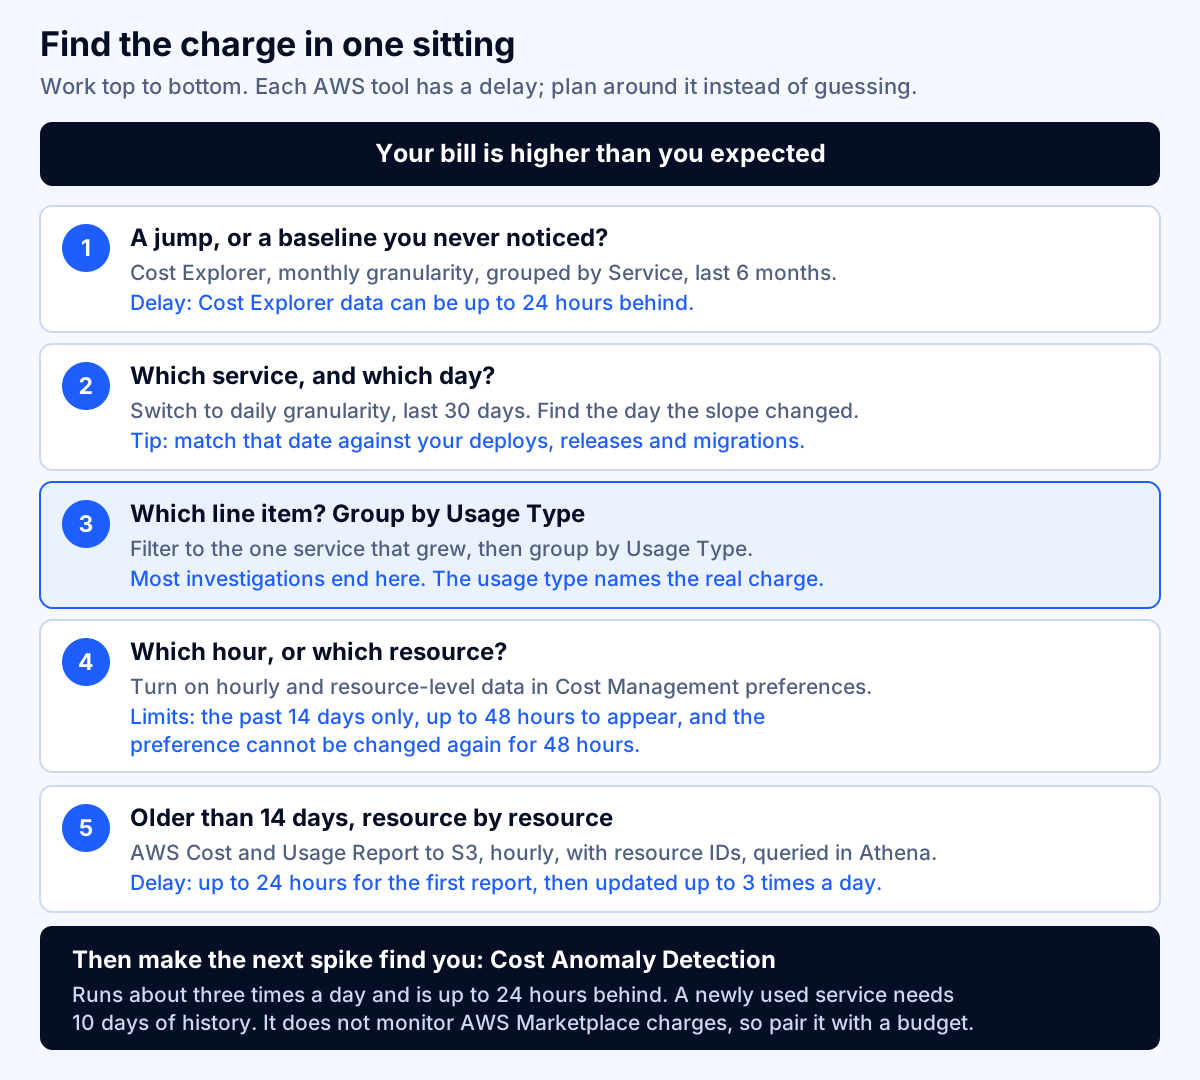
Most people fail to find a spike not because the data is missing, but because each AWS cost tool has a delay or a window that nobody mentions until an afternoon is gone.
Step 1: monthly, grouped by Service
Six months of monthly data tells you whether you have a jump or a slope. Cost Explorer gives you the current month plus up to 13 months of history by default, and forecasts the next 18 months.
Step 2: daily, grouped by Service
Switch granularity to Daily over the last 30 days. You are looking for the day the slope changed, not the biggest bar. Write that date down and compare it against your deploy log, your release notes and anything that changed in a vendor integration. A surprising share of spikes land on the day someone merged a branch, raised a log level, or enabled a feature in a third-party dashboard.
Step 3: filter to one service, group by Usage Type
This is the step that actually answers the question, and the one most people skip. AWS service names are too coarse to be useful: "EC2-Other" can mean NAT gateways, EBS volumes, snapshots, Elastic IP addresses or data transfer. The Usage Type dimension names the charge.
Step 4: hourly and resource-level data, if you still cannot see it
You can opt in to hourly granularity and resource-level data under Cost Management preferences in the Billing and Cost Management console. Before you do, know the constraints:
- Hourly data and daily resource-level data cover only the past 14 days.
- It can take up to 48 hours for a preference change to show up in Cost Explorer.
- After you save, you cannot change the preference again for 48 hours.
- Resource-level data at daily granularity is selected per service, and the dropdown only offers services your organization used in the last six months.
That makes this a tool you turn on before you need it, not during an incident. Turning it on today will not explain last Tuesday.
Step 5: Cost and Usage Reports for anything older or more detailed
An AWS Cost and Usage Report breaks costs down by the hour, day or month, by product resource, or by tags you define, and lands in an S3 bucket you own. AWS updates it at least once a day and up to three times a day, and the first report can take up to 24 hours to arrive. Reports routinely exceed a gigabyte and get split past roughly a million rows, which is why most teams query them with Amazon Athena rather than a spreadsheet.
This is the only path to per-resource history beyond the 14-day Cost Explorer window. If you have never set one up, do it now so the data exists the next time you need it.
Decode the usage types that actually appear on your bill
Usage types look like machine noise and are in fact the most precise information on your bill. These are the ones behind most surprises, with the US East (N. Virginia) rate attached.
| Usage type | What it is | Rate |
|---|---|---|
NatGateway-Hours |
A NAT gateway existing, regardless of traffic | $0.045 / hour |
NatGateway-Bytes |
Every gigabyte a NAT gateway processes, in or out | $0.045 / GB |
DataTransfer-Out-Bytes |
Traffic leaving AWS for the internet | $0.09 / GB, first 10 TB |
DataTransfer-Regional-Bytes |
Traffic in, out or between Availability Zones | $0.01 / GB |
USE1-USW2-AWS-Out-Bytes |
N. Virginia to Oregon (a pair of Region codes) | $0.02 / GB |
USE1-USE2-AWS-Out-Bytes |
N. Virginia to Ohio | $0.01 / GB |
USE1-PublicIPv4:InUseAddress |
A public IPv4 address attached to something | $0.005 / hour |
USE1-PublicIPv4:IdleAddress |
A public IPv4 address attached to nothing | $0.005 / hour |
USE1-VpcEndpoint-Hours |
An interface (PrivateLink) endpoint, per AZ | $0.01 / hour |
USE1-VpcEndpoint-Bytes |
Data processed by an interface endpoint | $0.01 / GB, first 1 PB |
EBS:SnapshotUsage |
EBS snapshot storage, standard tier | $0.05 / GB-month |
USE1-DataProcessing-Bytes |
CloudWatch Logs ingestion, Standard log class | $0.50 / GB |
TimedStorage-ByteHrs |
Log storage in CloudWatch, or object storage in S3 | $0.03 or $0.023 / GB-month |
CW:MetricMonitorUsage |
CloudWatch custom metrics, first 10,000 | $0.30 / metric-month |
CW:AlarmMonitorUsage |
CloudWatch alarms, standard resolution | $0.10 / alarm-month |
Requests-Tier1 |
S3 PUT, COPY, POST and LIST requests | $0.005 / 1,000 |
Requests-Tier2 |
S3 GET and all other requests | $0.004 / 10,000 |
LoadBalancerUsage |
An Application or Network Load Balancer existing | $0.0225 / hour |
LCUUsage |
Load balancer capacity units consumed (ALB) | $0.008 / LCU-hour |
ConfigurationItemRecorded |
AWS Config recording a resource change | $0.003 / item |
Two of these deserve a note. TimedStorage-ByteHrs appears under both CloudWatch Logs and S3 at different rates, so always read the usage type together with the service. And a usage type containing two Region codes and AWS-Out-Bytes is always inter-Region transfer — which is how people discover that cross-Region replication, not their users, is the top line on the bill.
The nine usual suspects, and the fix for each
1. NAT gateways
The most common large surprise, because it charges twice: $0.045 per hour for existing and $0.045 per GB for everything that passes through. A NAT gateway moving 1 TB a month costs about $79. Three of them, one per Availability Zone, moving 5 TB between them, costs about $324.
AWS's own guidance names two fixes. First, if resources send significant traffic across Availability Zones, put them in the same Availability Zone as the NAT gateway, or create a NAT gateway in each Availability Zone that has resources — otherwise you pay regional transfer on top of NAT processing. Second, if most traffic through the NAT gateway goes to AWS services, use endpoints: gateway endpoints for Amazon S3 and DynamoDB carry no additional charge at all, and interface endpoints cost $0.01 per endpoint-hour per Availability Zone plus $0.01 per GB, against $0.045 per GB through the NAT gateway.
The honest trade-off: gateway endpoints exist only for S3 and DynamoDB. For everything else you are comparing $0.01 per GB plus an hourly charge per Availability Zone against $0.045 per GB, so endpoints win on volume and lose on long-tail services you barely touch. And if your traffic is genuinely internet-bound — package registries, webhooks, third-party APIs — no endpoint helps, and the NAT gateway is the price of having a private subnet.
2. Public IPv4 addresses
Since February 1, 2024, AWS charges $0.005 per hour for every public IPv4 address, whether it is attached to a running resource or sitting idle, across EC2, RDS, EKS and other services in every Region. That is $3.65 a month each. A dozen forgotten Elastic IP addresses from old experiments cost $43.80 a month to do nothing.
The fix is to find and release them. Public IP Insights, part of Amazon VPC IP Address Manager, launched alongside the charge specifically to show public IPv4 usage at no cost. The AWS Free Tier for EC2 includes 750 hours of public IPv4 per month for the first 12 months, which is exactly one address — worth knowing before you conclude the charge is a mistake.
3. EBS volumes and snapshots that outlived their instances
Terminating an instance does not necessarily delete its volumes, and it never deletes its snapshots. A gp3 volume keeps billing at $0.08 per GB-month and a standard-tier snapshot at $0.05 per GB-month indefinitely, with no usage signal to tell you they are abandoned.
Two concrete wins here. Move gp2 volumes to gp3: $0.10 per GB-month becomes $0.08, a 20% cut, and gp3 includes a free baseline of 3,000 provisioned IOPS and 125 MB/s of throughput. And for snapshots you keep only for compliance, the archive tier is $0.0125 per GB-month against $0.05 — a 75% reduction — at the cost of a restore delay.
4. CloudWatch Logs with no retention policy
This is the quietest one. By default, log data is stored in CloudWatch Logs indefinitely. A new log group's retention shows as "Never Expire" until somebody changes it, so every debug line you have ever emitted is still on your bill at $0.03 per GB-month, and ingestion costs $0.50 per GB in the Standard log class.
Three levers, in order of effort:
- Set retention on every log group. Thirty days covers most debugging. Note that CloudWatch marks events for deletion at the retention boundary but typically takes up to 72 hours to actually delete them, and events marked for deletion stop adding to archival storage cost.
- Use the Infrequent Access log class for logs you keep for audit rather than search: $0.25 per GB ingested instead of $0.50, and stored at $0.006 per GB-month.
- Stop emitting what you never read. Ingestion, not storage, is usually the larger number, and the only fix for ingestion is logging less.
Audit custom metrics and alarms at the same time. At $0.30 per metric-month for the first 10,000 metrics and $0.10 per standard-resolution alarm, a per-container metric dimension that nobody graphs can quietly become a four-figure line.
5. RDS, which charges for more than you think
Stopping an RDS instance stops the instance-hour charge and nothing else. AWS is explicit: while a DB instance is stopped you are still charged for provisioned storage including Provisioned IOPS, for backup storage covering manual snapshots and automated backups inside your retention window, and for the public IPv4 address if the instance is publicly accessible. Worse for cost planning, if you do not manually start a stopped instance within seven consecutive days, RDS starts it for you so it does not miss maintenance updates. Teams that "stop" dev databases on Friday are often paying full instance hours again by the following weekend without noticing.
RDS storage is also more expensive than people assume: gp3 is $0.115 per GB-month Single-AZ, $0.23 Multi-AZ, and $0.345 for Multi-AZ with readable standbys — against $0.08 for the same storage class on raw EBS. Multi-AZ doubles both the instance rate and the storage rate. It is often the right call for production. It is rarely the right call for staging.
For non-production databases, the fix is a scheduled stop and start that re-stops after the seven-day auto-start, not a one-off manual stop.
6. S3 buckets that nobody has curated
S3 Standard is $0.023 per GB-month for the first 50 TB. Standard-Infrequent Access is $0.0125, Glacier Instant Retrieval $0.004, and Glacier Flexible Retrieval $0.0036. Lifecycle rules that move objects down those tiers are the highest-leverage S3 change for most teams.
Three traps worth knowing before you write the rules:
- Minimum storage durations. Objects deleted or overwritten before 30 days in Standard-IA, One Zone-IA or Intelligent-Tiering are still billed for 30 days, and Glacier Instant Retrieval bills a 90-day minimum. Moving short-lived objects to a cheaper class can cost more than leaving them alone.
- Intelligent-Tiering has a monitoring charge of $0.0025 per 1,000 objects per month. For millions of small objects that fee can exceed the storage savings.
- Incomplete multipart uploads. Abandoned upload parts sit in your bucket invisibly. AWS recommends a lifecycle rule using the
AbortIncompleteMultipartUploadaction to minimize storage costs, and notes that removing incomplete parts does not incur early-delete charges.
Request charges matter at scale too: $0.005 per 1,000 PUT, COPY, POST and LIST requests, and $0.004 per 10,000 GET requests. An application that lists a prefix on every page load can spend more on requests than on storage.
7. Data transfer, in all four of its flavors
Transfer is the hardest line to reason about, because the same byte costs four different amounts depending on where it goes.
| Path | Rate (US East, N. Virginia) |
|---|---|
| Inbound from the internet | No charge |
| Out to the internet | $0.09 / GB first 10 TB, then $0.085, $0.07, $0.05 |
| Between Availability Zones in the Region | $0.01 / GB, billed in and out |
| To another AWS Region | $0.01 / GB to Ohio, $0.02 / GB to Oregon and most others |
AWS customers receive 100 GB of data transfer out to the internet free each month, aggregated across all services and Regions. That allowance hides the problem for small applications and disappears the moment you serve files.
The cross-Availability-Zone line is the one that catches well-intentioned teams. Spreading an application across three Availability Zones for resilience is good engineering; routing every database read and every cache lookup across an Availability Zone boundary to do it is an avoidable bill. Keep chatty paths inside one Availability Zone and reserve cross-AZ traffic for replication and failover.
8. Load balancers and AWS Config, the per-unit services nobody models
An Application Load Balancer is $0.0225 per hour plus $0.008 per load balancer capacity unit-hour; a Network Load Balancer is the same hourly rate with LCUs at $0.006; a Classic Load Balancer is $0.025 per hour plus $0.008 per GB processed. Four load balancers that each front one service cost $65.70 a month in hourly charges before any traffic. Consolidating onto one Application Load Balancer with host or path routing is usually worth an afternoon.
AWS Config charges $0.003 per configuration item recorded and $0.001 per rule evaluation for the first 100,000 evaluations. That is cheap per unit and expensive in aggregate when you record every resource type in every Region, including the ones that change constantly. Record what your control framework actually requires, in the Regions you actually use.
9. The free tier or credits ending
The most common cause of a bill that steps up once and stays up. Under the plan introduced in July 2025, a new AWS free account plan expires either six months after sign-up or when Free Tier credits are depleted, whichever comes first. New customers receive $100 in credits at sign-up and can earn an additional $100, and more than 30 always-free services continue regardless.
Nothing changes inside your account when that happens. The same resources simply start billing at list price. If your bill tripled on a date that matches your account's anniversary rather than a deploy, look here first.
Is the fix worth your engineer's time?
Not every finding is worth acting on, and a cost program that chases $4 line items loses credibility fast. Price the fix before you queue it.
The median wage for network and computer systems administrators was $47.66 per hour in May 2025, according to the Bureau of Labor Statistics. Employer costs for employee compensation averaged $49.46 per hour worked for civilian workers in June 2026, of which $33.85 was wages and salaries — a loaded cost of roughly 1.46 times wages. That puts a US systems administrator at about $70 per hour fully loaded, and a senior engineer meaningfully higher.
A simple rule that holds up in practice:
| Monthly saving | Worth how much effort | Example |
|---|---|---|
| Under $25 | Only if it is a settings change under 15 minutes | Release two idle Elastic IP addresses |
| $25–$200 | Up to half a day, including testing | Set retention on 40 log groups; gp2 to gp3 |
| $200–$1,000 | Up to three days, with a rollback plan | Add VPC endpoints; consolidate load balancers |
| Over $1,000 | A scoped project with a design review | Re-architect cross-AZ data paths; commitment strategy |
Two caveats. A $30 monthly saving is $360 a year and recurs forever, so the payback math is kinder than it looks for anything that stays fixed. And some fixes carry risk that dwarfs the saving: deleting a snapshot you cannot restore, or collapsing one NAT gateway per Availability Zone into one shared gateway and creating a single point of failure, are not cost optimizations. They are availability decisions wearing a cost optimization costume.
Guardrails so it does not happen again
Finding the charge is the easy half. Not being surprised again takes three things, and it is worth being precise about what each one can and cannot do.
Cost Anomaly Detection applies machine learning to your net unblended costs and tells you what moved, ranked by dollar impact across service, account, Region and usage type. Its real behavior matters: it runs about three times a day, depends on Cost Explorer data that is up to 24 hours behind, takes 24 hours to start detecting after you create a monitor, and needs 10 days of historical usage before it can detect anomalies for a newly used service. AWS managed monitors track up to 5,000 values in a dimension automatically; customer managed monitors let you pick up to 10. Individual alerts need an Amazon SNS topic, while email-only subscriptions get daily or weekly summaries, with the daily summary generated at 00:00 UTC. And it does not monitor AWS Marketplace charges, apart from third-party foundation models on Amazon Bedrock — so pair it with a budget if you buy through Marketplace.
AWS Budgets is an alert, not a cap. Budgets update up to three times a day, typically 8–12 hours after the previous update, and AWS states plainly that you might incur costs exceeding your threshold before the notification arrives. Set a cost budget on forecasted as well as actual spend, because the forecasted alert is the one that arrives early enough to matter. If you need something closer to enforcement, budget actions can apply a restrictive IAM policy or stop instances when a threshold is crossed — still after the fact, but automatically.
Cost allocation tags are what turn "the bill went up" into "team B's new service went up". They must be activated in the Billing and Cost Management console before they appear on reports, and the delay is real: it can take up to 24 hours for tag keys to appear on the cost allocation tags page, and up to another 24 hours for them to activate. Tagging is a forward-looking control. It will not help you explain yesterday.
Two more worth turning on. Compute Optimizer needs an opt-in, then analyzes the last 14 days of CloudWatch metrics to find idle and oversized resources across EC2, Auto Scaling groups, EBS volumes, Lambda functions, ECS on Fargate, RDS and Aurora, NAT gateways, DynamoDB, ElastiCache and more; the enhanced infrastructure metrics feature that extends the lookback to 93 days is a paid option. Trusted Advisor is the one to check your support plan against first: its full check set, including cost optimization, requires AWS Business Support+, AWS Enterprise Support or AWS Unified Operations. On Basic Support you get the Service Limits category and selected Security and Fault tolerance checks, with no automatic refresh. Note too that AWS has announced Developer Support and Business Support will be discontinued on January 1, 2027, with Business Support+ at a $29 per month minimum per account, and Enterprise On-Ramp discontinued the same day.
Rate optimization: what Savings Plans do and do not fix
Once your usage is right, you can pay less for the same usage. The FinOps Foundation draws this distinction cleanly: usage optimization is about resources being "properly selected, correctly sized, only run when needed, appropriately configured, and highly utilized," while rate optimization is about how much you pay for what you do consume.
Compute Savings Plans reduce costs by up to 66% against On-Demand and apply to EC2 usage regardless of instance family, size, Availability Zone, Region, operating system or tenancy, and also to Fargate and Lambda usage. EC2 Instance Savings Plans go to 72% but lock you to an instance family in a Region. Both come as one-year or three-year commitments.
The order matters and gets reversed often. Rightsize first, commit second. A three-year commitment on instances you were about to delete locks in the waste for three years. Work through the usage side of the list above, let the new baseline settle for a month, then commit to the part of it you are confident about and leave headroom on demand.
When not to optimize
Honest cases where the right answer is to leave it alone:
- The waste is smaller than the meeting. If a finding saves $12 a month and takes two people an hour to discuss, you have spent more than you saved.
- You are about to change the architecture. Tuning instance sizes six weeks before a migration to containers is work you will throw away.
- The cost buys resilience you actually need. Multi-AZ databases, a NAT gateway per Availability Zone and cross-Region backups are expensive on purpose. Price them, name them as deliberate choices, and stop counting them as waste.
- Nobody owns the result. Cost work without an owner and a monthly review reverts within two quarters. If you cannot name the person who will look at the number next month, build the guardrails first and do the optimizations later.
- The spend is growing because the business is growing. Cost per customer, per transaction or per request is the number to watch. A total that rises while unit cost falls is a healthy bill.
What to do this week
In order, and none of it takes long:
- Run the five-step triage on your current bill and write down the top three usage types by dollar increase.
- Turn on hourly and resource-level data in Cost Management preferences, and set up a Cost and Usage Report to S3, so the data exists next time.
- Create a cost budget with both actual and forecasted alerts, plus one AWS managed Cost Anomaly Detection monitor on AWS services.
- Set retention on every CloudWatch log group that still says "Never Expire".
- Find and release idle public IPv4 addresses, and delete snapshots whose instances are gone.
- Check whether a gateway endpoint for S3 or DynamoDB would take traffic off your NAT gateway.
- Only then look at Savings Plans.
If the answer turns out to be architectural — data crossing Availability Zones by design, a database tier sized for load that never arrived, or AI workloads whose token and GPU costs nobody modeled — that is a design problem rather than a billing problem. The same discipline applies to the numbers in what on-premise LLM deployment really costs over five years, the monthly run costs in RAG chatbot development cost, and the budgets in AI agent development cost and custom MCP server hosting. If the line that is growing is model tokens rather than infrastructure, the levers are different, and we rank them by payback in LLM API cost optimization.
Fleurant AI does AI-powered cloud cost optimization alongside custom web apps and software, so the people reading your bill are the same people who can change the architecture behind it. If you want a second pair of eyes on a bill you cannot explain, talk to a specialist: the discovery call is free, and a specialist replies within one business day.
Confirm anything with cost or contractual consequences against the current AWS pricing pages for your Region before acting on it, and check commitment decisions with whoever owns your budget.
Frequently asked questions
Why is my AWS bill so high when I have no users?
Because most of a small AWS bill is scaffolding, not compute. A single NAT gateway costs $32.85 a month in US East (N. Virginia) before it moves one byte, an Application Load Balancer adds $16.43, each public IPv4 address adds $3.65, and a db.t4g.medium RDS instance adds $47.45. Add storage, snapshots, logs and AWS Config and a conventional three-tier setup reaches about $159 a month with zero traffic.
How do I find out which AWS service caused a sudden cost spike?
Open Cost Explorer, set daily granularity over the last 30 days and group by Service to find the day the slope changed. Then filter to that one service and group by Usage Type — the usage type string, not the service name, names the actual charge. If you need the specific resource, turn on hourly and resource-level data in Cost Management preferences, but note it only covers the past 14 days and takes up to 48 hours to appear.
Does AWS Budgets stop my spending when I hit the limit?
No. A budget is an alert, not a cap. AWS Budgets updates up to three times a day, typically 8–12 hours apart, and AWS warns that you can exceed your threshold before the notification arrives. The closest thing to a cap is a budget action that applies a restrictive IAM policy or stops instances when a threshold is crossed, and even that fires after the spend has already happened.
Why am I being charged for an EC2 instance I stopped?
Stopping an instance stops the instance-hour charge, not the storage behind it. EBS volumes keep billing at $0.08 per GB-month for gp3, snapshots at $0.05 per GB-month, and any public IPv4 address at $0.005 per hour whether it is attached to anything or not. Stopped RDS instances are the same: AWS continues to charge for provisioned storage and backup storage, and restarts the instance automatically after seven consecutive days.
Is a NAT gateway really worth $33 a month?
It depends what crosses it. The hourly charge is $0.045 and the data processing charge is another $0.045 per GB, so a NAT gateway carrying 1 TB a month costs about $79. If most of that traffic goes to Amazon S3 or DynamoDB, a gateway endpoint carries it at no additional charge. If it goes to other AWS services, an interface endpoint costs $0.01 per endpoint-hour per Availability Zone plus $0.01 per GB. If it is genuinely internet-bound, you need the NAT gateway.
What happened to my AWS free tier?
As of the July 2025 change, a new AWS free account plan expires either six months after sign-up or when your Free Tier credits run out, whichever comes first. New customers get $100 in credits at sign-up and can earn $100 more. More than 30 services remain always free, but everything else switches to list pricing when the plan ends — which is why month seven often looks nothing like month six.
Should I buy a cost optimization tool or hire someone?
Start with the native tools, because the first pass is usually the cheapest one. Cost Explorer's console views are free, Cost Anomaly Detection and Cost and Usage Reports need no license, and Compute Optimizer only needs an opt-in. Third-party tools and outside help earn their keep when the waste is structural — architecture that moves data across Availability Zones, or commitment coverage that nobody is managing — not when the fix is a retention setting.
Sources
- Amazon VPC Pricing, Amazon Web Services
- Pricing for NAT gateways, Amazon Web Services
- Gateway endpoints, Amazon Web Services
- New - AWS Public IPv4 Address Charge + Public IP Insights, AWS News Blog
- Amazon EC2 On-Demand Pricing, Amazon Web Services
- Amazon EBS pricing, Amazon Web Services
- Working with log groups and log streams, Amazon Web Services
- Stopping an Amazon RDS DB instance temporarily, Amazon Web Services
- Analyzing your costs and usage with AWS Cost Explorer, Amazon Web Services
- Configuring multi-year and granular data, Amazon Web Services
- Detecting unusual spend with AWS Cost Anomaly Detection, Amazon Web Services
- Managing your costs with AWS Budgets, Amazon Web Services
- What are AWS Cost and Usage Reports?, Amazon Web Services
- Activating user-defined cost allocation tags, Amazon Web Services
- What is AWS Compute Optimizer?, Amazon Web Services
- AWS Trusted Advisor, Amazon Web Services
- Compute Savings Plans and EC2 Instance Savings Plans pricing, Amazon Web Services
- AWS Free Tier now offers $200 in credits and 6-month free plan to explore AWS at no cost, Amazon Web Services
- FinOps Framework: Usage Optimization, FinOps Foundation
- Network and Computer Systems Administrators: Occupational Outlook Handbook, U.S. Bureau of Labor Statistics
- Employer Costs for Employee Compensation, June 2026, U.S. Bureau of Labor Statistics